2017 Saw Consistent Growth in Total MICSS Population
Yet Junior One Enrollments Drop in Four Consecutive Years
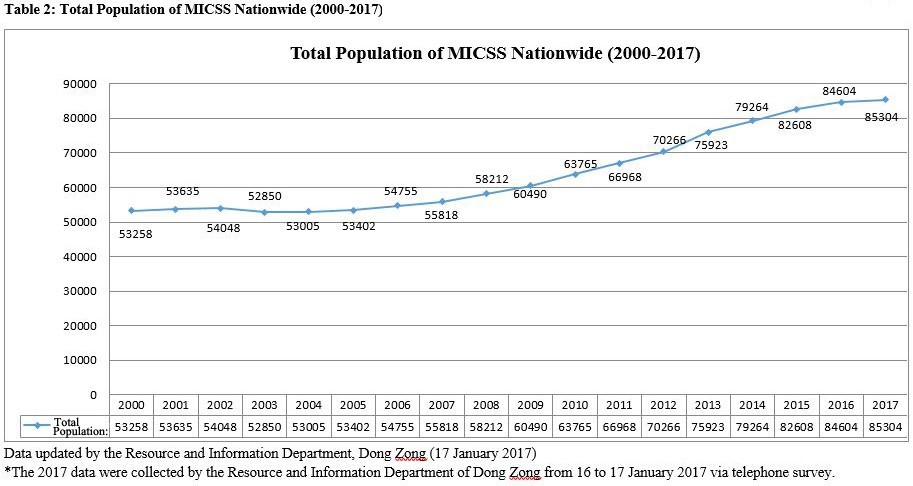
(1) This year (2017) the total population of all the Malaysian Independent Chinese Secondary Schools (henceforth MICSSs) reaches 85,304 and thus an increase of 700 students or an increasing scale of 0.82 percent in comparison to last year’s (2016) 84,604 students which was collected from all the MICSSs nationwide through questionnaire survey. It is also noted to be the 15 consecutive year’s growth in MICSS population since 2003.
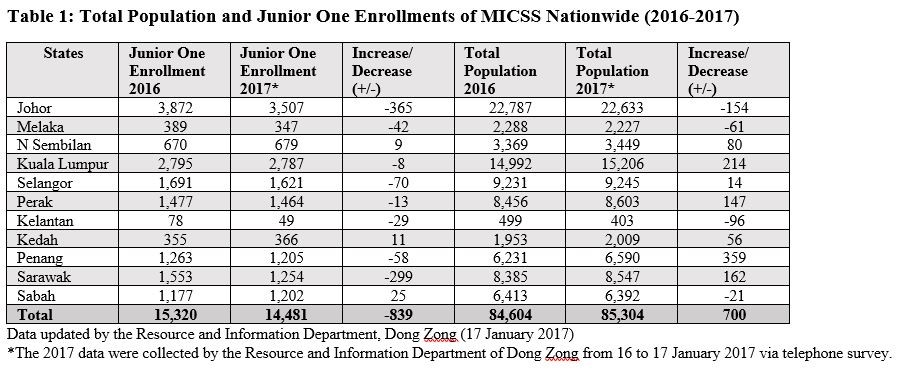
(2) What is worthy of attention being, there is a decrease of 839 students or a decrease scale of 5.48 percent when the new enrollment for Junior One student in 2017 (n=14,481) is compared with that of 2016 (n=15,320, data collected in June survey) as shown in Table 1.
Basic Statistics
(1) 2017 marks historical high within fifteen consecutive year’s growth in MICSS population
This year (2017), the total population of MICSS is 85,304 students which is the highest since the 1973 Chinese Education Resurgence and it is also the 15 consecutive year’s growth since 2003. In 2003, the total population of MICSS is 52,850 students, compared to this year’s 85,304 students, there is an increase of 32,454 students or an increasing scale of 61.41 percent over a 15-year span (Table 2).
(2) Junior One Enrollments fall for four consecutive years
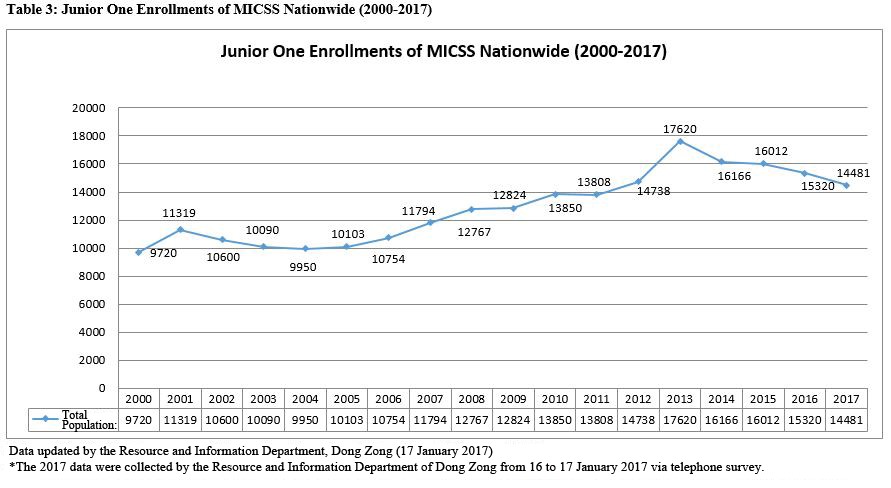
The total number of enrollments for MICSS Junior One nationwide this year is 14,481 students, thus a decrease of 839 in comparison to June 2016 survey and this shows a four consecutive years’ drop for Junior One enrollment nationally. Within the ten most decreased school in student number, Johor and Sarawak region are comparatively more prominent (7 schools), northern, central and eastern Malaysia each has one and the total decrease number is 701 which is equivalent to 83.55 percent of the total decrease. 2013 saw the highest Junior One enrollment nationally with 17,620 students only it plummets thereafter on a yearly basis. Figures show a drop from 17,620 enrollments in 2013 to 14,481 the following year, meaning a decrease of 3,139 students thus stands a decrease scale of 17.81 percent (Table 3).
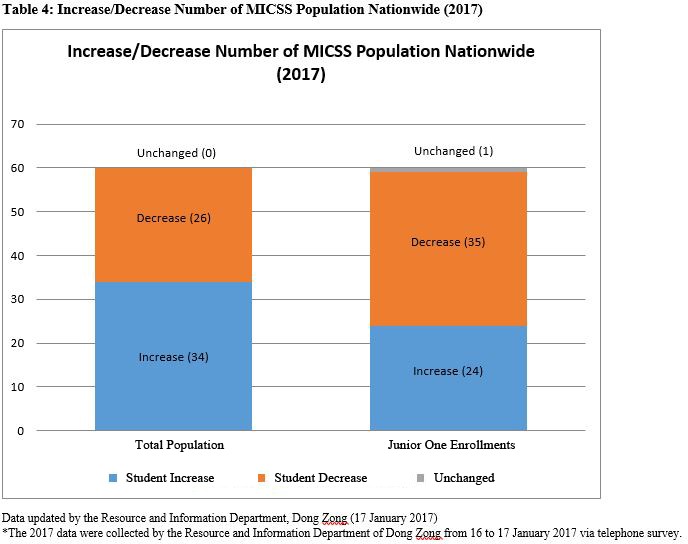
(3) On the total population of MICSS, data show an increase in 34 schools, whereas 26 schools decrease in number. As for Junior One enrollment, 24 schools increase, 35 schools decrease but only one school sustains in figure.
In terms of total MICSS population, compared with 2016, this year 34 schools increase which stands at 56.67 percent nationally; 26 schools decrease (grows from 25 schools in 2016 to 26 schools in 2017) which is 43.33 percent nationwide. Besides, for the number of Junior One enrollment, in comparison to 2016, there is increase in 24 schools or 40 percent nationally, 35 schools decrease (grows from 34 schools in 2016 to 35 schools in 2017) and thus stands at 58.33 percent and only one school sustains the number which is equivalent to 1.67 percent (Table 4).
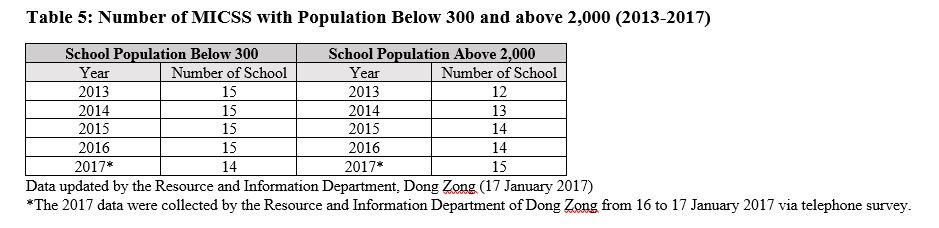
(4) 14 schools have less than 300 students nationwide in 2017
From 2015 to 2016, there are 15 schools which have less than 300 students for four consecutive years; whereas this year (2017) the number drops to 14 which is roughly one-fourth of all MICSSs (Table 5).
(5) 15 schools exceed 2,000 students nationwide in 2017
From 2015 to 2016, there is a record of 14 schools which exceed 2,000 students in population; this year (2017), the number increases from 14 to 15 which is one-fourth of all MICSSs (Table 5).
Basic Analysis
(1) The drop in Junior One enrollment for four consecutive years is correlated to shortage of classrooms/space and intake decrease
Notwithstanding the number of Junior One enrollment decreases nationwide for four consecutive years, the total MICSS population remains unaffected but instead increases on a yearly basis. It is cautioned if the number of Junior One enrollment does not raise or sustain but drops continuously, the total population of all MICSSs will be affected tremendously. (Though it is likely when the Junior One enrollment drops year to year but the total number of the enrollment is comparatively more than drop-outs, the total population will increase.)
Preliminary judgement suggests that the cause of the decrease in Junior One enrollment nationally is correlated with over-intake of some large-scale MICSSs which actually results in the shortage of hardware and facilities as well as classrooms and space. When the student number saturates in these schools, cutting down intake will be the eventuality.
(2) Currently, the number of students of all MICSSs polarizes in distribution: it is over populated in urban schools and many students are denied in admission yet in rural area, the imbalance phenomena of student shortage and non-conformance Junior One enrollment are noted. Survey shows in 2017, the highest population of the large-scale MICSSs exceed 5,000 yet the lowest population of small-scale MICSSs is less than a hundred. The ten most populated schools (including branch schools) are as follows: 5 in Selangor state and Kuala Lumpur region, 3 in Johor state, 1 each in Negeri Sembilan and Sabah state and the total population of these schools is 41,177 or 48.28 percent of the total population nationwide. Yet the ten least student schools are all located in eastern Malaysia with a total population of 1,363 or 1.6 percent nationally. The figures strongly reveal the disparities and imbalance in terms of MICSS population nationwide.
Summary
In comparison to 2016, there is an increase of 700 students in the overall MICSS enrollment reaching 85,304 students which once again rewrote the highest record documented and sustains the longest ever increase record over the 15-year span since 2003. Yet, the increasing scale for the increased number shows a decrease from 2.42 percent in 2016 to 0.82 percent this year. On the other hand, the number of enrolled Junior One students this year when compared to 2016 reveals a decrease of 839 students, totals 14,481 students or a decrease scale of 5.48 percent (grows from 4.32 percent in 2016 to 5.48 percent), showing a four consecutive year’s decrease in Ju